
If you have never been part of an Indigenous Knowledge study, you may be wondering what all the fuss is about – particularly when it comes to maps of land use and occupancy, and Traditional Ecological Knowledge (TEK). It’s one thing to hear about the power of maps - how a good map can tell a story, influence project planning and design, regulatory decisions around major projects, and influence the outcome of negotiations. It’s another to actually see one of these maps for yourself. When you see your Nation’s mapped data overlaid with a proposed project’s footprint, such as a mine or transmission line, the power to demonstrate potential impacts is evident. But your Indigenous Knowledge is precious and confidential – as is that of all our clients – so we have had no public examples to show you. Until now!
Real map, mocked-up data
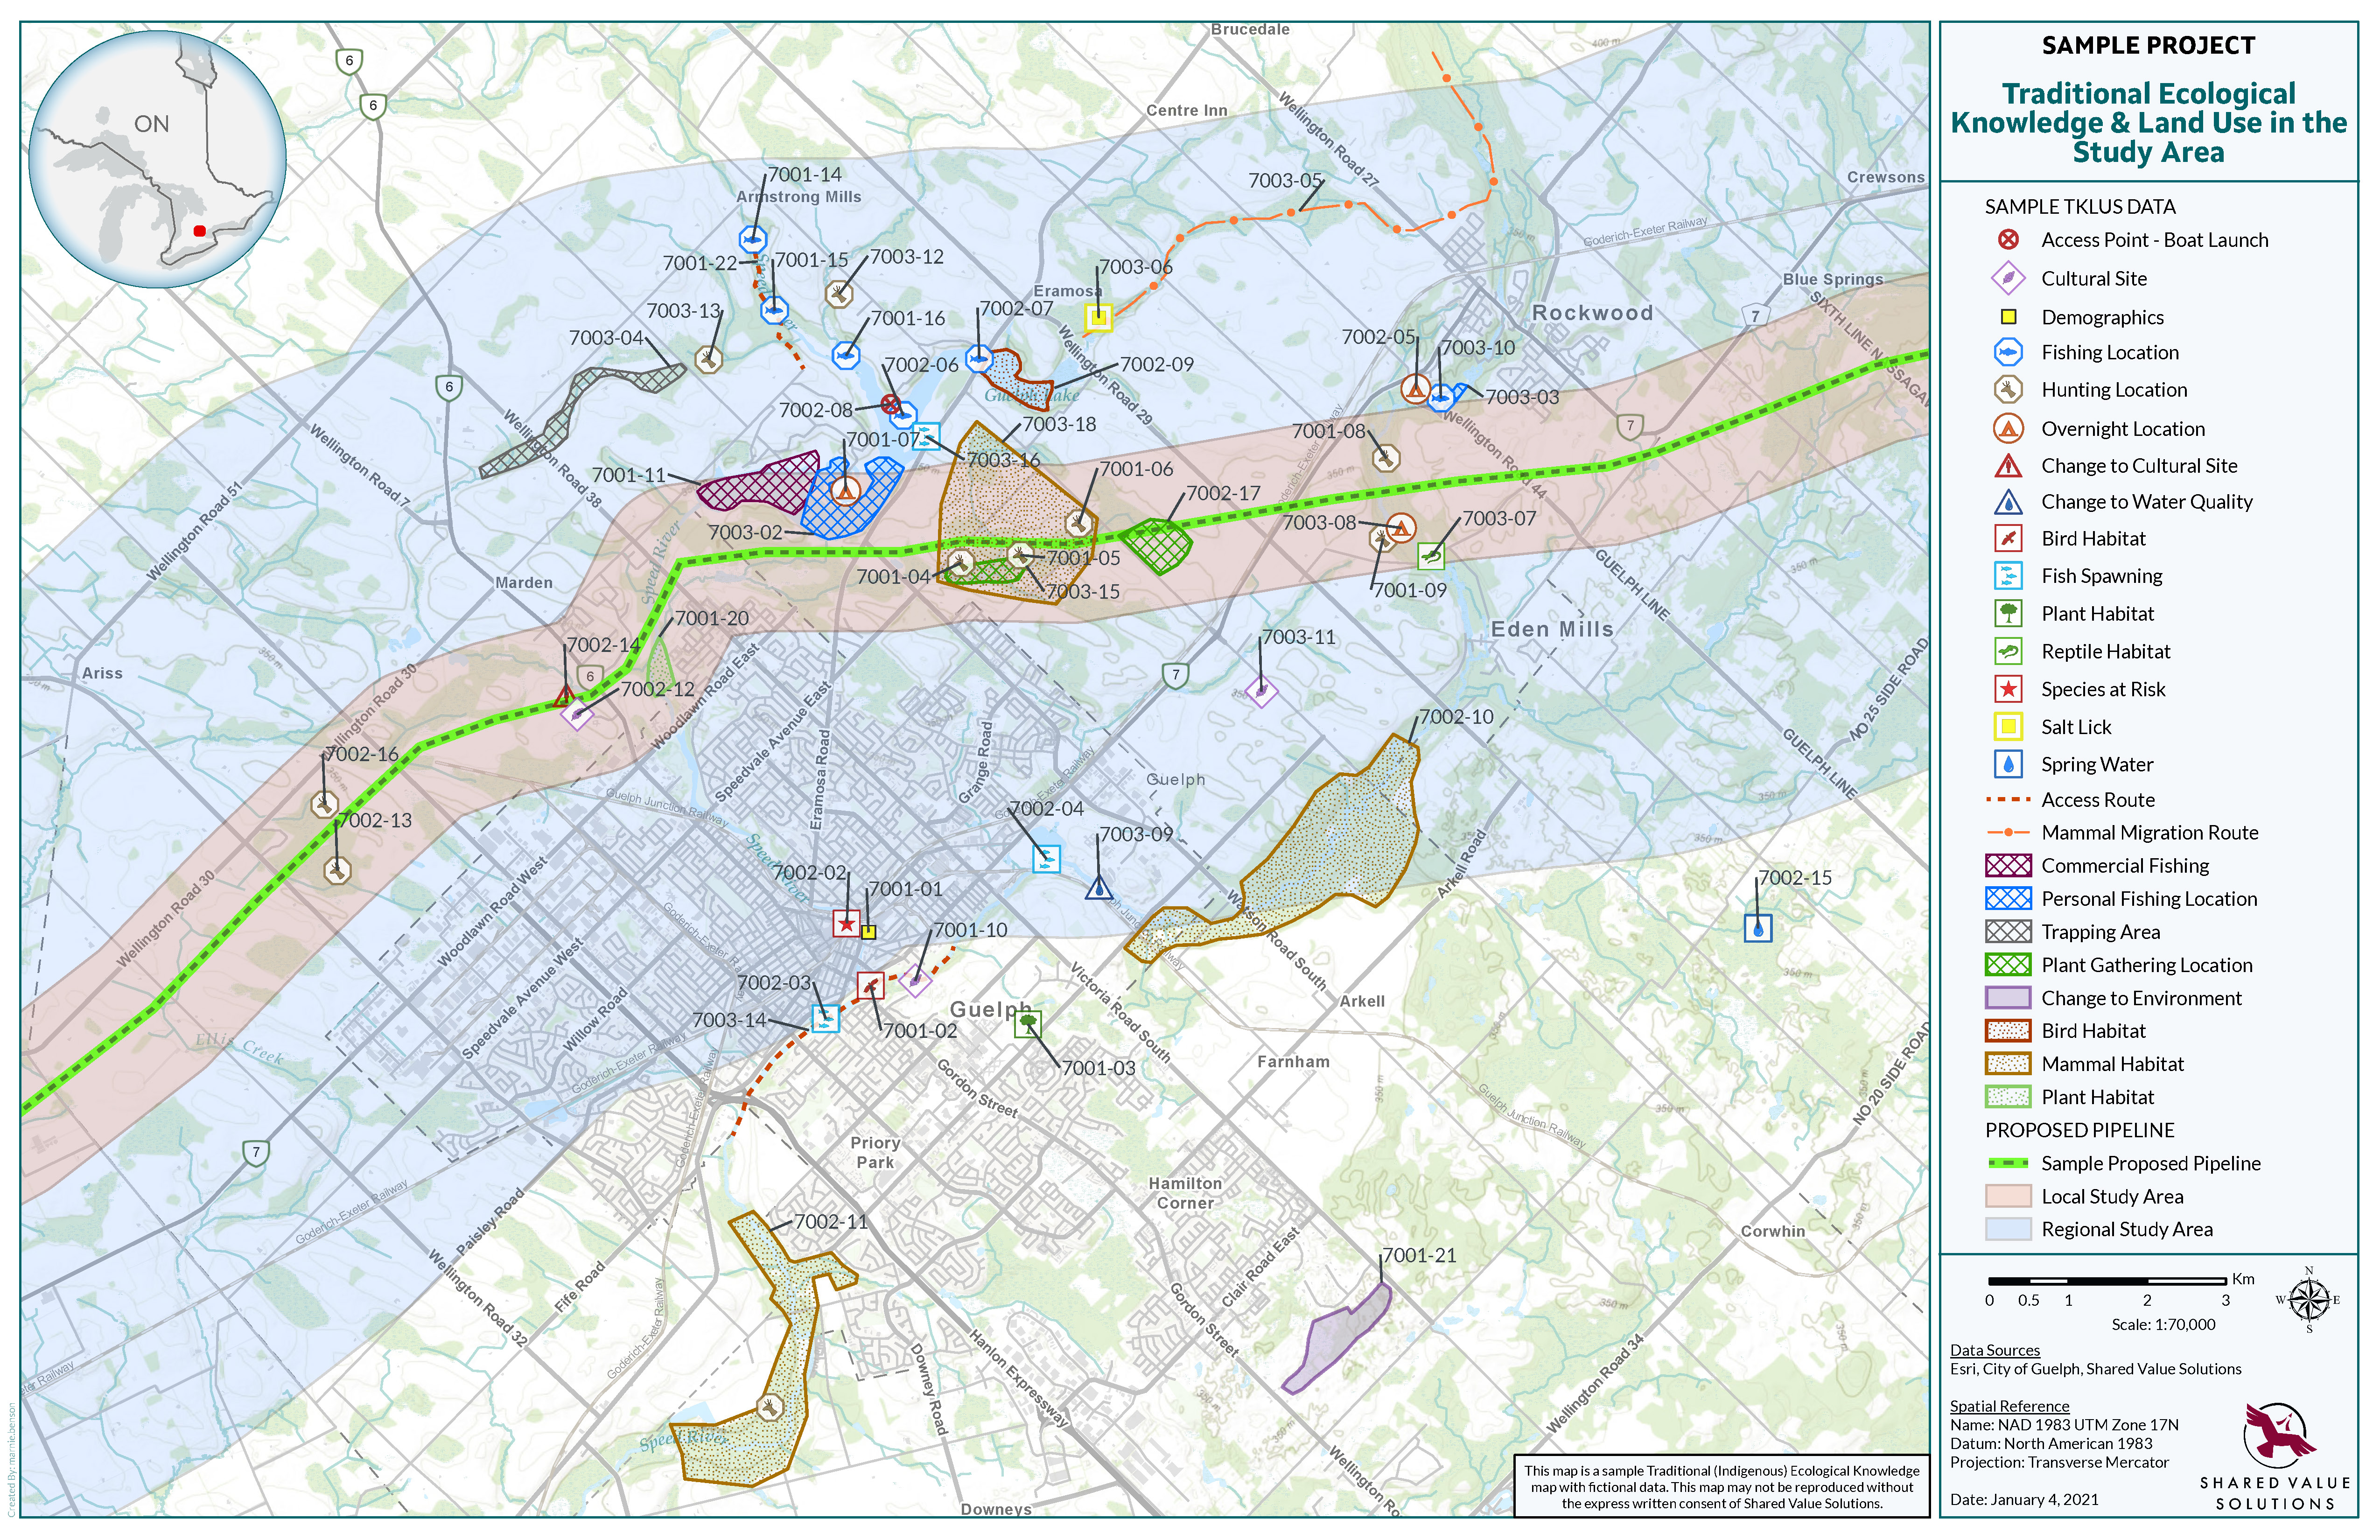
SVS’s Marnie Benson, social researcher and GIS mapping professional, has put together a demonstration Indigenous Knowledge map, together with a table of data, to demystify how the data can be displayed. “It’s fake data (well maybe some of my own personal ecological knowledge) centered over Guelph, Ontario,” explains Marnie. “But it exemplifies the style and content of what we would typically produce for our clients.” Citizens of Guelph, rest assured that the proposed pipeline marked on the map is also fake. But for so many of our clients, the experience of seeing a proposed pipeline snake across their Territories is very real. Let’s take a closer look at what’s on this map, and how it might affect the outcomes for this pipeline.
What's on the map?
This map is what’s referred to as a “composite map,” because it shows all the data participants mapped in the study. For example, if your researchers interviewed 12 people, all of the features they mapped would be on here. Features on this map include harvesting locations, cultural sites, important habitats, access routes – all the ways people use the land, and what they know about it. As you can see, there is a legend on the right hand side that explains what the symbols and shapes represent. The colours and the symbols are customizable, as are the categories.
What's in the table?
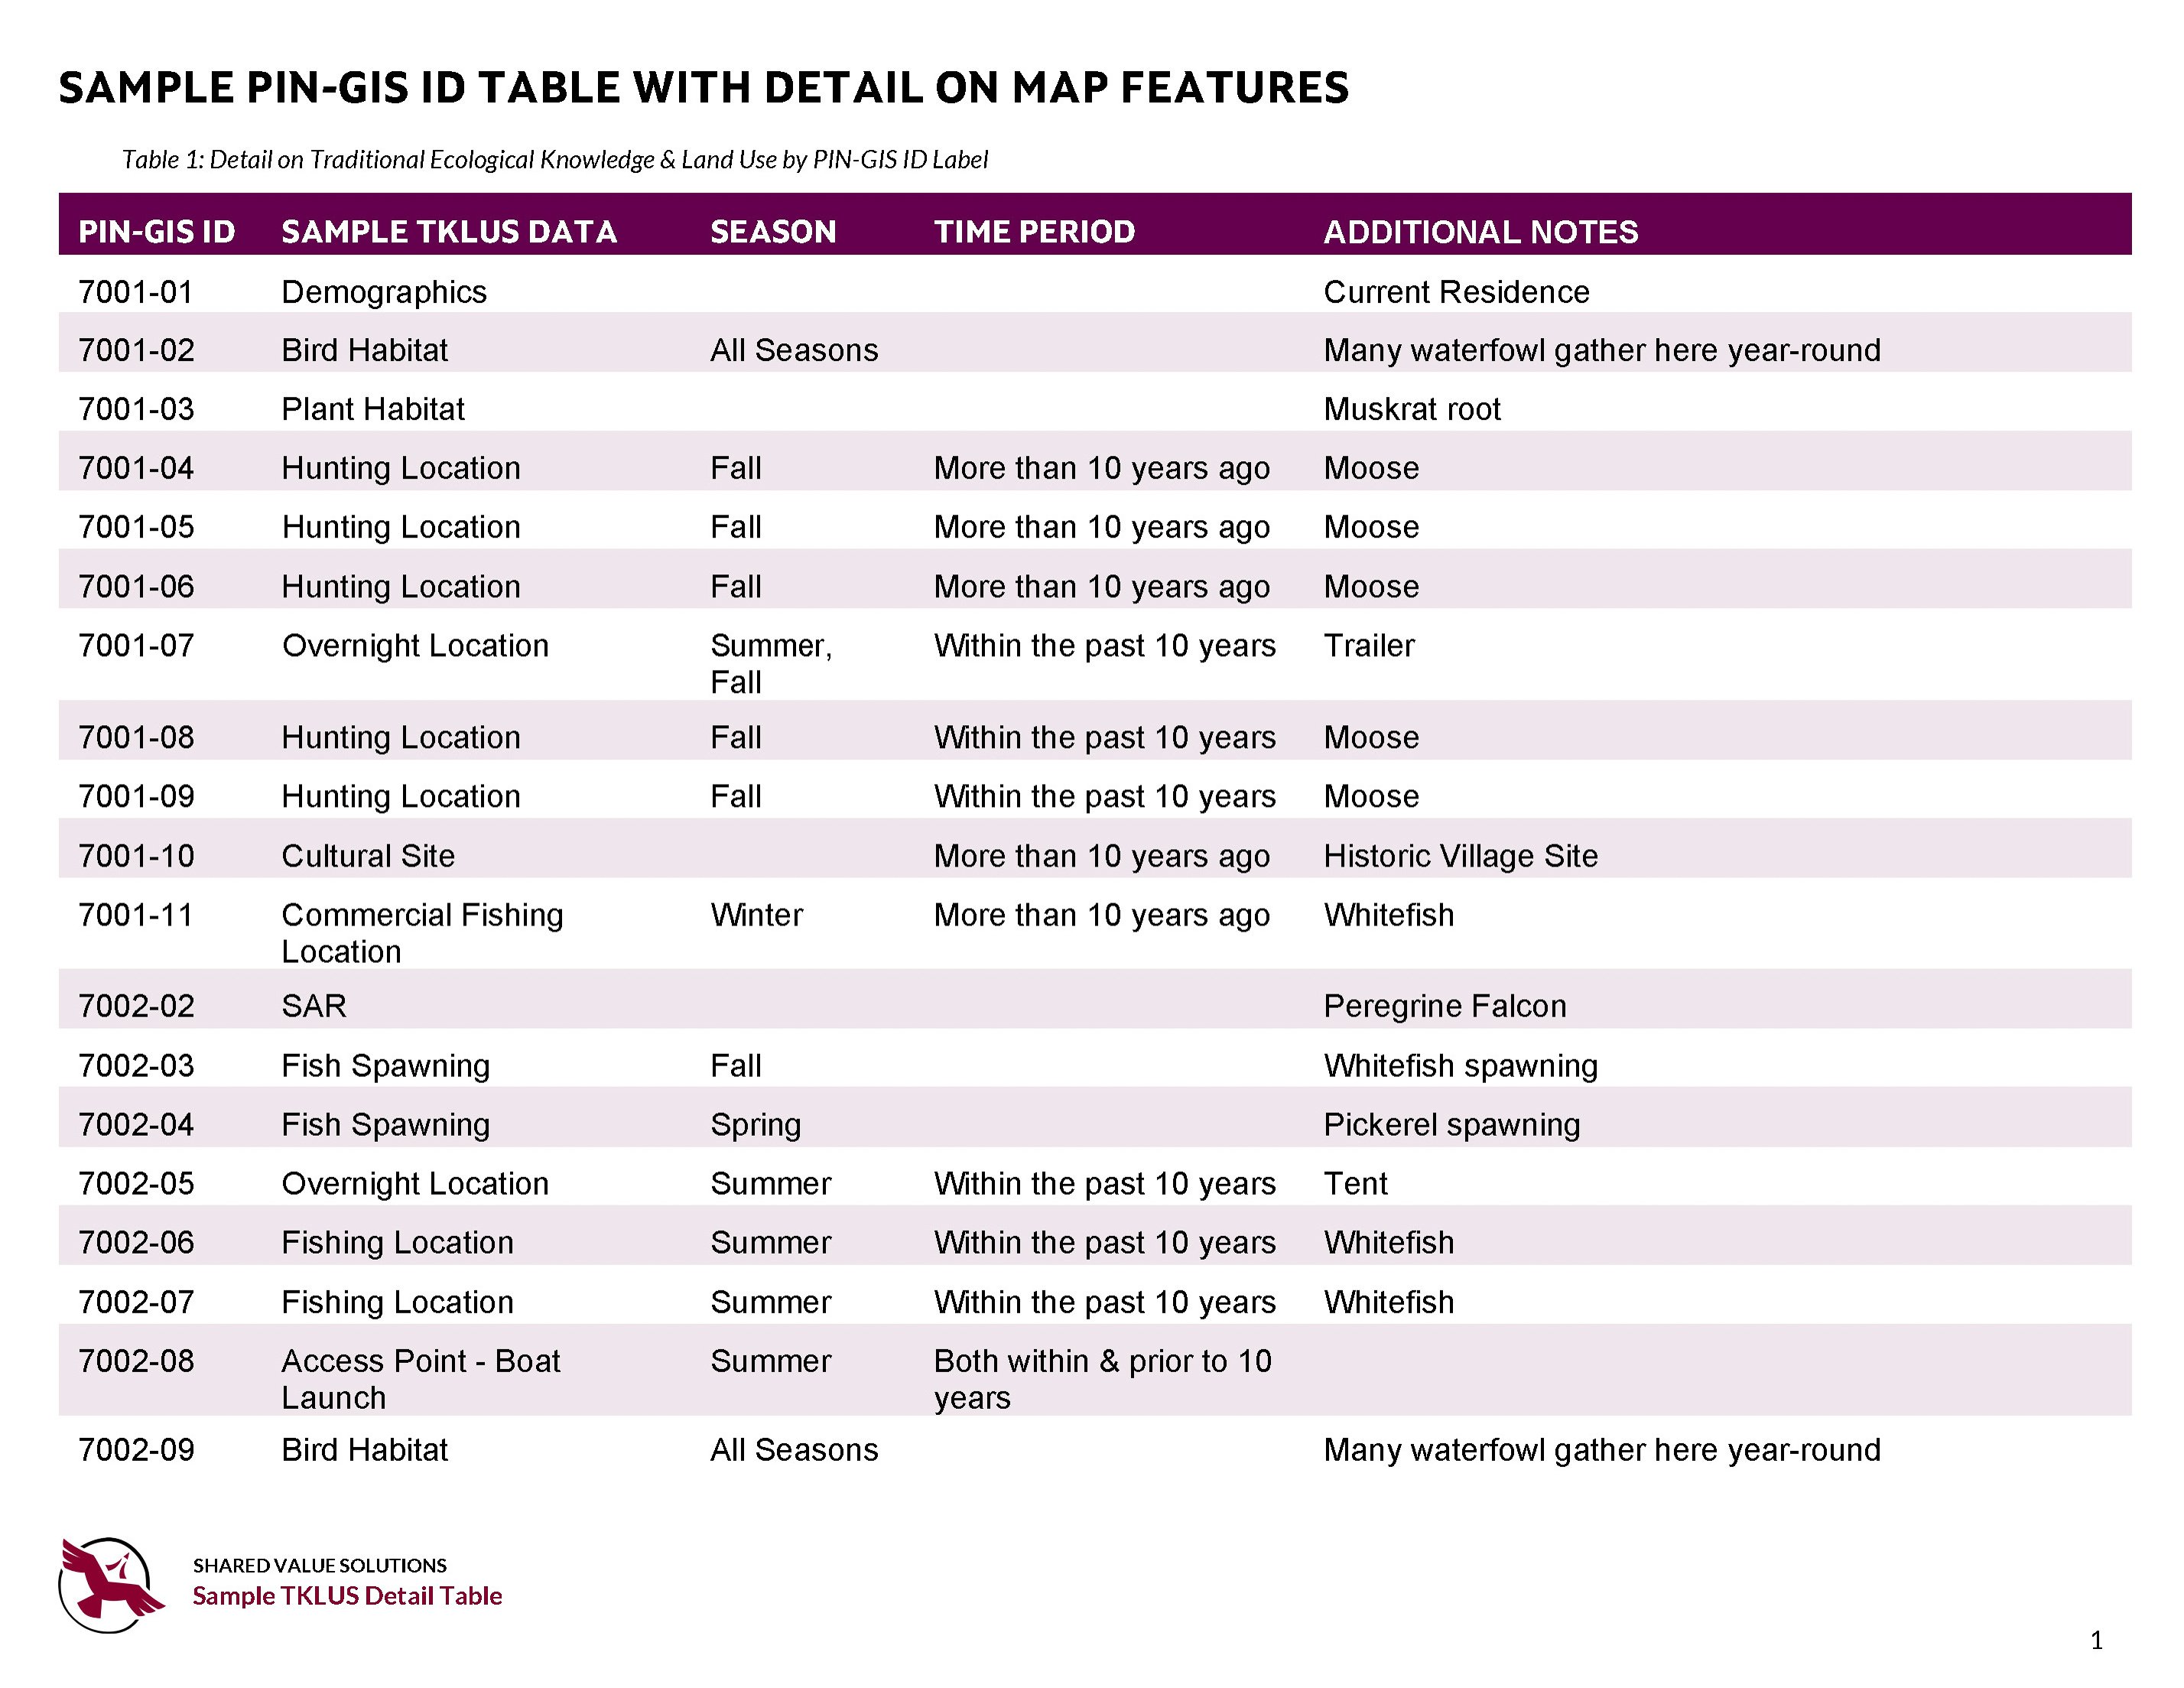
The little numbers associated with each feature on the map are called PIN-GIS ID labels. These unique identifiers allow us to give more detail about what each point is about, as displayed in the table below. Each participant in the study is given their unique PIN, each feature they map has a number, and each type of feature has a code. That way, you can slice and dice the data in whichever way serves your purposes. For example, you could choose to display only moose harvesting locations. Or you could choose to show plant gathering locations, and not display moose harvesting at all. You may choose to include the PINs and the table with more detail, or you may not.
What to include on your map to tell your story
You may choose to only include the mapped features that overlap with the project’s study area in the table, because these are the values that have the greatest potential to be affected by the proposed project - and should be studied during an impact assessment. On our demonstration map, for example, there appears to be a prime moose habitat and harvesting location smack dab in the middle of the study area. Ideally, you would take that information to the regulators and proponent and work together to determine how to protect that habitat, or mitigate for any disruption of it (please note, actually seeing a moose inside Guelph city limits would indicate the world has changed dramatically from present reality!).
The possibilities to tailor your map to meet your objectives are endless.
A note on ownership and confidentiality
It’s worth noting that while you may choose to share a map with this level of detail, you are most often not required by either the regulator or the proponent of a proposed project to do so. There are many ways to obscure the details. For example, you may choose not to distinguish between what the points represent at all. An innovative way to further conceal the exact locations of Indigenous Knowledge is to use grid mapping (read all about it here) instead of mapping point locations.
So there you have it, folks! A clear example of an Indigenous Knowledge map that has the potential to affect the outcome of this proposed pipeline project – for the better. If you have any questions at all about what you are seeing here, please don’t hesitate to reach out!
Like what you're reading?
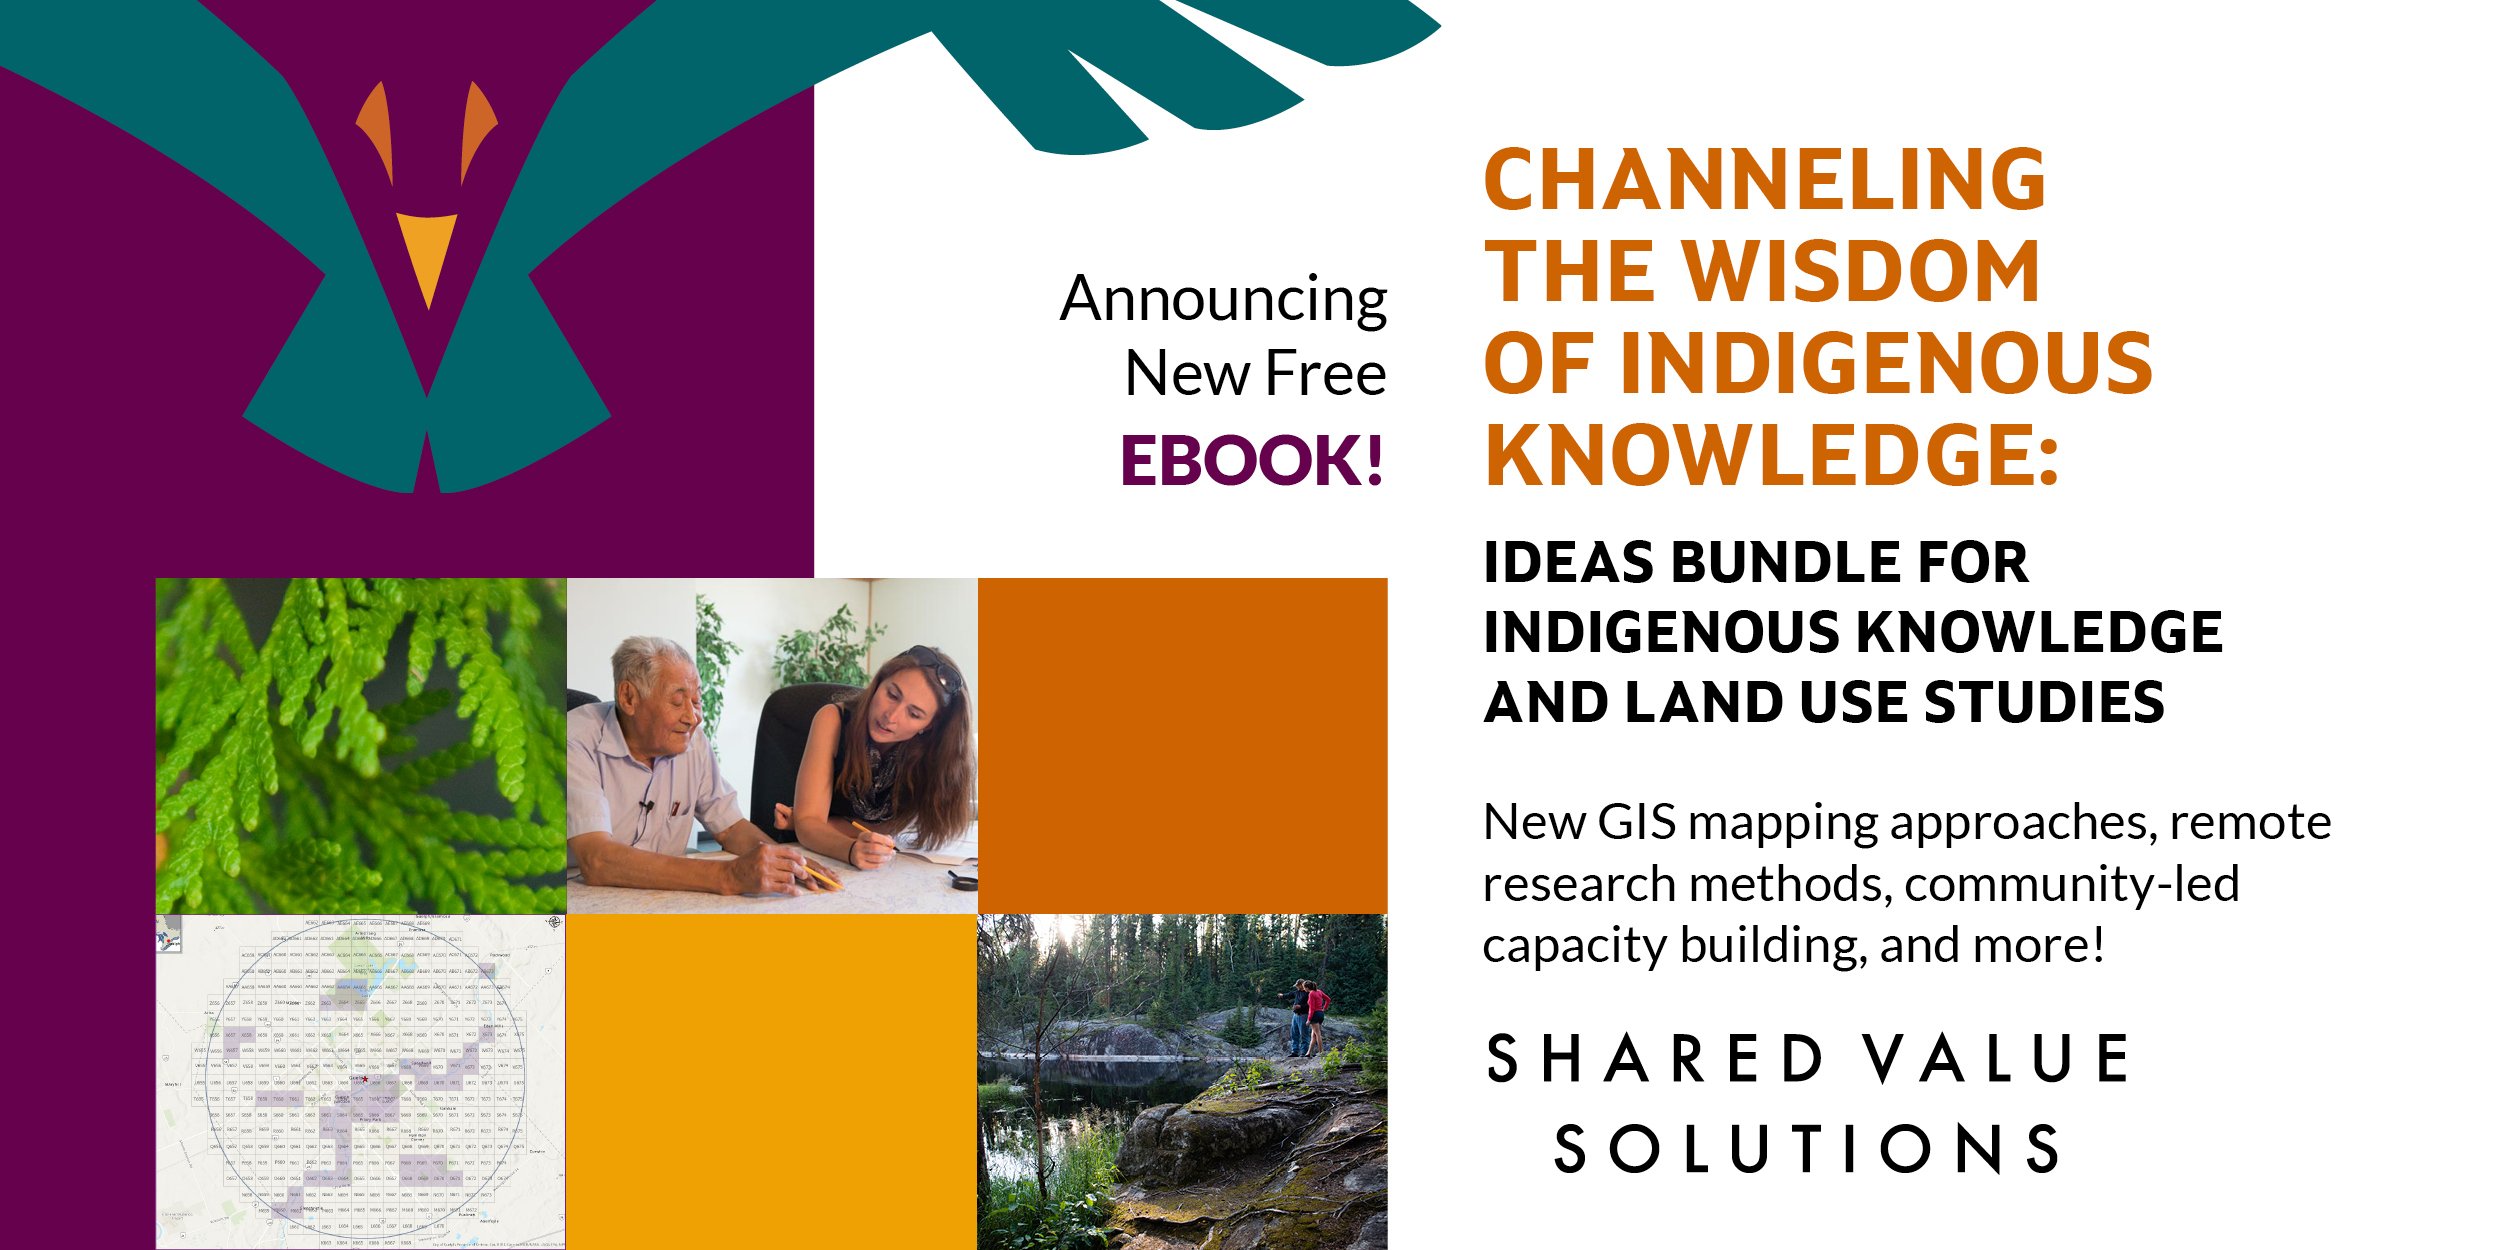
Download our new Ideas Bundle for Indigenous Knowledge and Land Use Studies!
Download our latest eBook for free to hear about new GIS mapping approaches, remote research methods, community-led capacity building, and more!
We have bundled a collection of our most popular posts from the blog series, Indigenous Knowledge Matters, into the newest volume in our popular eBook collection.
A celebration of visionary leaders, and helpful resources
The chapters in this series are a celebration of the extraordinary Nations and visionary leaders we have had the privilege of working with on Indigenous Knowledge studies from coast, to coast, to coast - with some resources and ideas for you to use in your own journeys. Their voices fill the chapters with the wisdom and insight of lived experience conducting studies for their Nations.
What's in this eBook?
These posts are bundled in our eBook so you can read them at your leisure all in one place:
- A Mi'gmaq Government’s Grand Plan: Building Capacity Through Indigenous Knowledge Studies
- Talent Search: Sample Job Description for Community Researchers
- Magnetawan Makes a Movie: Gathering Traditional Knowledge in the Digital Age
- Remote Research Adventures with the Algonquins of Ontario: Gathering Indigenous Knowledge in a Pandemic
- Teach Your Children Well: Maximize the Negotiation Impact of Indigenous Knowledge
- A New Approach to Protecting Indigenous Knowledge: Grid Mapping
- Filling in the Blanks: How to Show Cumulative Effects in Indigenous Knowledge Studies
- Maximizing the Impact of First Nation and Métis Knowledge in Impact Assessment
-
Fighting for the Environment as Stewards of the Land: Using Traditional Ecological Knowledge

About Us: Shared Value Solutions
We are an Canadian B Corp, and we assist Indigenous communities with support throughout regulatory processes surrounding major development projects like mines, hydroelectric facilities, transmission lines, highway expansions, oil and gas pipelines, natural resource transport applications and nuclear power.
We have deep context and experience behind the recommendations we provide, having worked for our clients on almost every major project in Canada over the last 10 years. For us, it’s all about building long-term relationships with our clients. We want to get to know you and what you want to do so we can help you move your plans forward.
- Impact Benefit Agreement Negotiation Support
- Technical Reviews and Regulatory Process Support
- Community and Economic Development Planning
- Indigenous Knowledge and Land Use Studies
- Environmental Monitoring
- Guardians Program Development
- Climate Change Readiness
- GIS and Mapping